


SPSS Data Analysis Step-by-Step Guide for PhD Research
- PATN Research and Technologies
- Apr 17
- 3 min read

Struggling to perform data analysis using SPSS for your PhD research?
You’re not alone.
Many research scholars find SPSS confusing—especially when it comes to selecting the right test, interpreting outputs, and presenting results correctly.
This step-by-step guide will help you understand how to perform SPSS data analysis from scratch, even if you’re a beginner.
🧠 What is SPSS in Research?
SPSS (Statistical Package for the Social Sciences) is one of the most widely used tools for statistical data analysis in academic research.
It helps researchers:
Analyze quantitative data
Perform statistical tests
Generate charts and reports
Interpret results accurately
🚨 Common Challenges Faced by PhD Scholars in SPSS
Before we start, here are common issues researchers face:
❌ Confusion in selecting statistical tests
❌ Errors in data entry
❌ Difficulty interpreting output tables
❌ Incorrect hypothesis testing
❌ Rejection due to wrong analysis
👉 This guide will help you overcome these step-by-step.
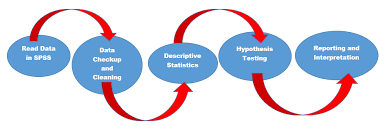
🧩 Step-by-Step SPSS Data Analysis Process
🔹 Step 1: Data Entry in SPSS
Start by entering your data correctly:
Open SPSS software
Go to Variable View
Define variables (name, type, label)
Go to Data View
Enter your dataset
👉 Ensure no missing or incorrect values
🔹 Step 2: Data Cleaning
Before analysis:
Check for missing values
Remove duplicates
Verify data consistency
👉 Clean data = accurate results
🔹 Step 3: Descriptive Statistics
Understand your data:
Go to: Analyze → Descriptive Statistics
Choose:
Mean
Median
Standard deviation
👉 Helps in summarizing your dataset
🔹 Step 4: Test of Normality
Check whether your data is normally distributed:
Go to: Analyze → Descriptive → Explore
Select:
Plots → Normality plots
👉 Determines whether to use parametric or non-parametric tests
🔹 Step 5: Choosing the Right Statistical Test
Based on your research:
Compare groups → t-test / ANOVA
Relationship → Correlation
Prediction → Regression
👉 (You can also refer to our guide on choosing statistical tests)
🔹 Step 6: Performing Statistical Tests
Examples:
✔ t-Test
Analyze → Compare Means → Independent t-test
✔ ANOVA
Analyze → Compare Means → One-way ANOVA
✔ Correlation
Analyze → Correlate → Bivariate
🔹 Step 7: Interpreting SPSS Output
This is the most important step:
Check p-value (significance level)
Analyze tables and charts
Compare results with hypothesis
👉 Incorrect interpretation = wrong conclusions
🔹 Step 8: Report Writing
Present results in your thesis:
Use tables and graphs
Explain findings clearly
Link results to objectives
📊 Common SPSS Statistical Tests Explained
t-test → Compare 2 groups
ANOVA → Compare multiple groups
Chi-square → Categorical data
Regression → Prediction analysis
Correlation → Relationship between variables
🛠️ Tips for Accurate SPSS Data Analysis
✔ Always define variables correctly
✔ Double-check data entry
✔ Choose test based on objective
✔ Validate assumptions before applying test
✔ Seek expert help if needed
🚀 When to Get Expert Help
If you are facing:
Difficulty selecting statistical tests
Confusion in SPSS output
Repeated rejection from guide
Tight submission deadlines
👉 It’s better to consult experts.
👉 Need expert help with SPSS data analysis?
Explore our PhD Data Analysis Services (SPSS, R, Python) and get accurate, reliable, and fast support for your research.
🏁 Conclusion
SPSS is a powerful tool for PhD data analysis, but using it correctly requires proper understanding of statistical methods and data interpretation.
By following this step-by-step guide, you can perform accurate analysis and improve your research quality.


Comments